










Use interaction data to improve menu content and QR placement without interpreting it as sales.
Before you start
- Generate enough public activity to compare periods.
- Decide which menu and metric answer the question.
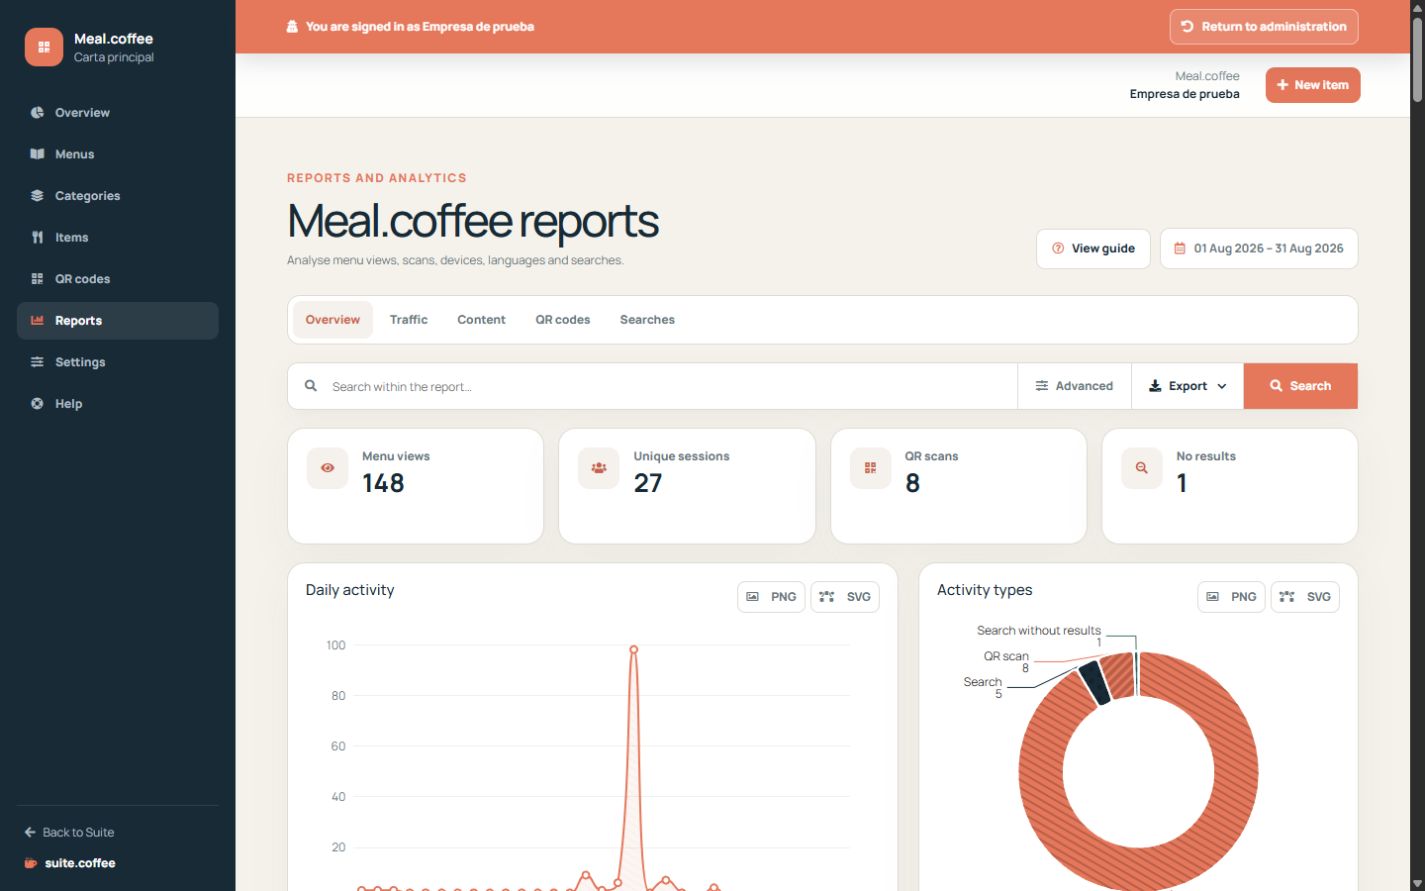
Choose the period and metric
Reports separate menu views, QR scans, searches, searches without results and filter activity. Review the period and menu before comparing totals.
Use breakdowns as signals
Languages, devices, menus, QR codes and search terms help improve content and placement. Activity indicates interaction with the menu; it is not a count of customers, orders, sales or payments.
Respect the privacy model
Meal stores a daily HMAC session hash derived from network and browser signals rather than retaining the visitor’s plain IP in the event. Exports are snapshots of the supported filtered scope and should still be handled according to your access policy.
Step by step
- Open Reports and choose the period.
- Select the report and, when available, the menu.
- Compare headline totals with daily and categorical breakdowns.
- Review searches without results and filter activity for content gaps.
- Export the current scope when a static copy is needed.
Final check
- Period and menu match the intended comparison.
- Views and scans are not described as customers or orders.
- The exported file reflects the visible filtered scope.
Tip: Treat searches without results as editorial feedback: they often reveal missing names, translations or products.